
A new cycle will start for me in August when I will join the OnCrawl teams in Bordeaux as Product Manager. This is a change that will allow me to keep data science as part of my working life.
For the SEO community, I have just created a new Open Source R package freshly named “oncrawlR” that allows you to obtain all the data enriched with logs and crawls by OnCrawl.
My goal is to write a series of articles to introduce you to the use of Data-SEO with all OnCrawl products.
OnCrawl offers many products:
- A semantic crawler in SaaS mode that visits and analyzes all the pages of your site to provide you with enhanced information on content, indexing, internal mesh, performance, architecture, images, etc.
- A log analyzer that helps you understand how Google behaves on each page of a site.
- A Data Platform that allows you to cross-analyze third-party data (logs, backlinks, analytics, csv, Search Console) with crawl data to understand their impact on site traffic.
- OnCrawl Developer: Unrestricted access to all OnCrawl’s enriched data via an API to build your own data analysis and visualizations or to integrate the data into your SEO Datamart
4 blog articles to boost your SEO
- In the first article, we will start using this new OncrawlR package which allows us access to very interesting metrics and we will see how to add customization.
- Next, in a second article, I will show you several methods to cluster your URLs.
- Then, in a third article, we will study how to use data science for very efficient prioritization.
- Finally, in the last article, we will look at a very practical application because we will see how to produce a PowerPoint or Word with all the above elements.
A few R?
R is a language dedicated to statistics and data science. Data scientists use it every day to perform complex processing on large volumes of data.
It is a computer language that requireslittle time to learn. In our DATASEOLABS courses, beginners are ready to use it on their own in one day. (customization and execution of SEO scripts, reading and writing files, using packages,…)
For Python lovers, don’t worry: I’ll do it all in Python, too.
Package Installation
You need to enter these two lines in your RStudio console
library(devtools)
devtools::install_github("voltek62/oncrawlR")
The package is now installed on your machine or server and ready to use.
Usage
To start getting OnCrawl data via the API, you need 4 elements:
- A subscription to OnCrawl Business, with the paid option for API access.
- Your API key: it is a unique identifier that allows you to authenticate with the OnCrawl API. In the next section, you will see how to retrieve it.
- The R language and R Studio software installed on your computer.
- The R oncrawlR package: everything will be detailed in the following steps.
Where to get your OnCrawl API key
Once you have your OnCrawl Business account, go to https://app.oncrawl.com/account/access-tokens and click on the “ADD API ACCESS TOKEN” button.
A page opens with your OnCrawl API key. You will need to use it with the oncrawlR package below.
That’s it! You are ready to recover all the enriched data via the OnCrawl API.
Using the OnCrawl API with the R package
Simply load the package with the following line and create a text file named “oncrawl_configuration.txt” at the root of your project.
library(oncrawlR)
key = VOTRECLE
debug = FALSE
api = https://app.oncrawl.com/api/v2/
oncrawlR currently includes 4 functions: initAPI, listProjects, listPages, listLogs
- initAPI
This function allows you to test and initialize the API. It returns “ok” if your key is correct.
initAPI("oncrawl_configuration.txt")
- listProjects
This function allows you to retrieve all your projects, and in particular the IDs of the latest crawls.
listProjects <- listProjects()
- listPages
This function allows you to retrieve all crawled pages. You have to pass it an argument that represents the crawl ID.
pages <- listPages(crawlId)
pages_fetched <- filter(pages,fetched=="True")
- listLogs
This function allows you to retrieve all data from the logs. You must pass it an argument that represents the project ID. It is important to ensure that the logs are received correctly in order to use this function.
logs <- listLogs(projectId)
Here is the full code to test the R package
library(jsonlite)
library(RCurl)
library(dplyr)
# init API
initAPI("oncrawl_configuration.txt")
list projects
listProjects <- listProjects()
# select specific lists
projects <- lapply(
listProjects,
function(x) c(x['id'],x['name'],x['domain'],x['last_crawl_id']
,x['log_monitoring_data_ready'],x['log_monitoring_processing_enabled'],x['log_monitoring_ready'])
)$projects
projects <- as.data.frame(projects, stringsAsFactors = F)
# get one of your last crawl with log monitoring
projectId <- projects$id[1]
crawlId <- projects$last_crawl_id[1]
# get your crawled pages
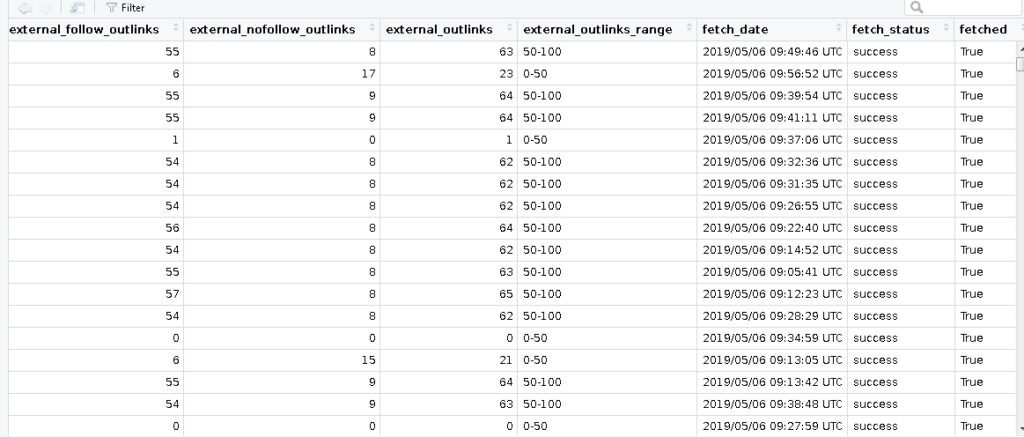
pages <- listPages(crawlId)
pages_fetched <- filter(pages,fetched=="True")
Using DataExplorer
In the field of data science, you can spend up to 80% of your time preparing the data. This is completely false when we have the right tools, like the little-known but useful “DataExplorer” R package or the OnCrawl Data Explorer that is integrated into the platform.
Oncrawl’s Data Explorer provides access to raw data for advanced analysis in the application. If you want to learn more about this feature, you can read the application’s help, watch the tutorial or read the feature presentation.
Now let’s go back to the R package “DataExplorer”.
I use it in all the data analyses I perform, and in a few minutes, we can analyze and prepare a database with 100 million rows for 150 columns.
DataExplorer allows you to do this with a few functions.Without knowing anything about the data, my first three tasks are almost always
library(DataExplorer)
## Find missing values
plot_missing(pages_fetched)
## Analyze each discrete and categorical variable
plot_bar(pages_fetched)
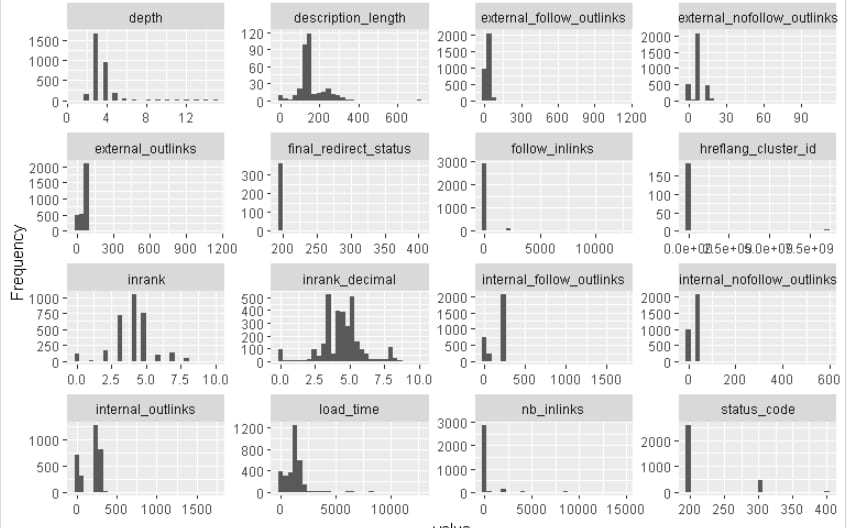
## Analyze each continuous variable
plot_histogram(pages_fetched)
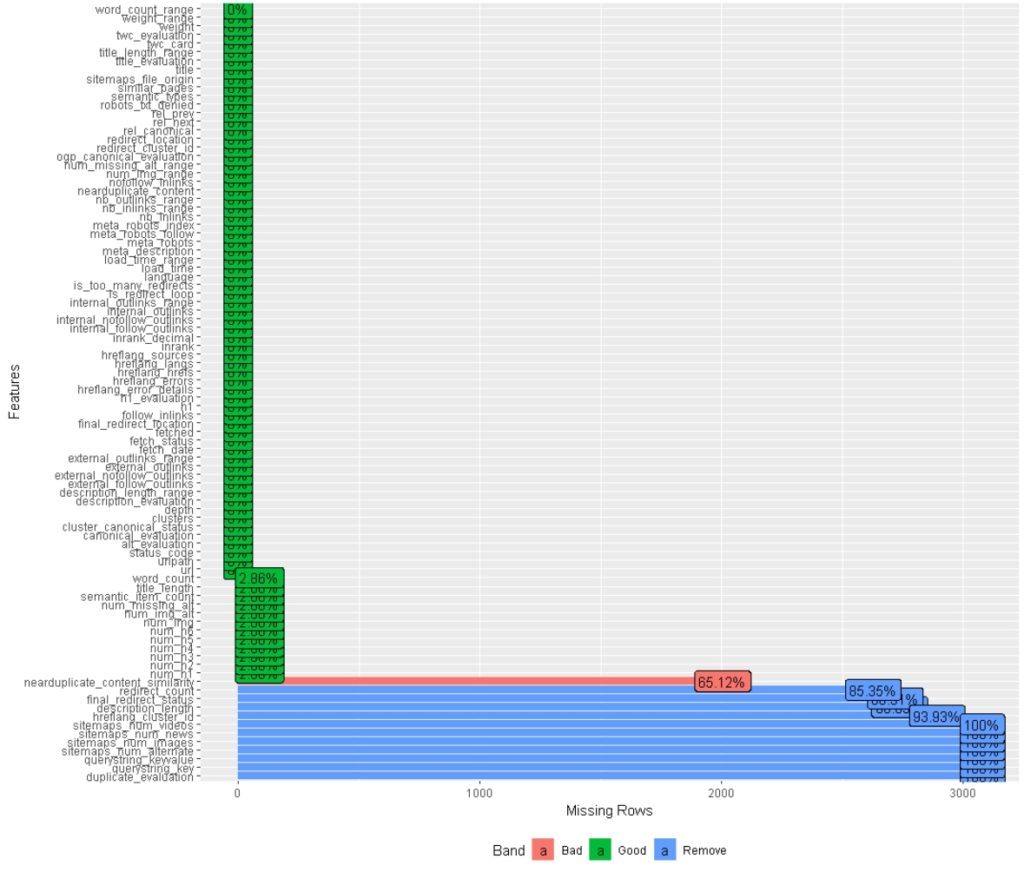
Not all variables are useful for each site, so you will quickly identify what is not relevant. Then, you can also have a quick overview of the situation.
To sum up, there are three main types of variables: continuous variables which are numerical variables with an infinite number of values between two values. While discrete variables are discrete variables with values that can be counted between two values.
Finally, there are also the categorical variables that are easier to understand because they have a finite number of distinct categories or groups.
With the 3 previous functions, you will identify the missing data and see the distribution of discrete, categorical and continuous variables.
After looking at the data, I can see that the variable status_code is actually discrete, and I want to transform it back into a discrete value with the function as.factor
pages_fetched$status_code <- as.factor(pages_fetched$status_code)
OnCrawl already offers many discrete variables but you can create new ones. Simply use the cut_interval function which divides the interval into as many groups as you wish.
for (col in c("num_h2"))
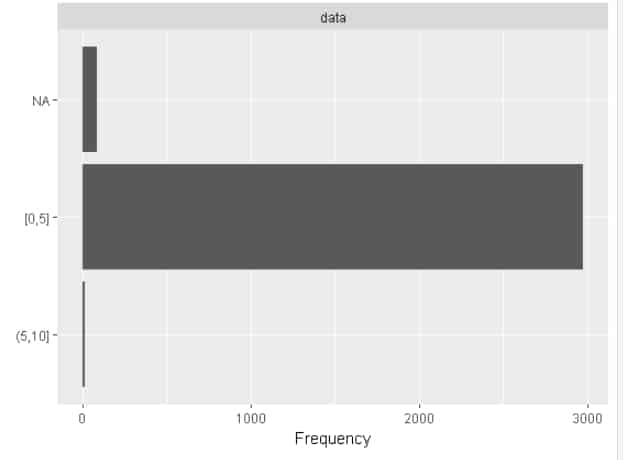
pages_fetched[[paste0(col, "_d")]] <- as.factor(ggplot2::cut_interval(pages_fetched[[col]], 2))
Here, for the number of H2, we split the group in two.
I will have URLs with 0 to 5 H2 and URLs with more than 5 H2 as well as URLs in NA, i.e. without H2
plot_bar(pages_fetched$num_h2_d)
At this point, we have a much better understanding of data distribution. We could also compare the load_time_range variable to all the other variables to build a model to predict it. But we will see a much more effective method in my third blog article.
plot_boxplot(pages_fetched, by = "load_time_range")
Mission accomplished
Now you have a package to get the enriched data from the OnCrawl API and a package to improve your data. In the following article, you will discover several methods to cluster your URLs, as it is important to track the integrity of this data with regard to the categories that have the most conversions