Bot Event Analysis is the analysis of data generated by bots in log files server to improve your SEO. It is entirely based on Process mining. Thanks to Wil van der Aalst for this excellent MOOC on Coursera and Tiago Duperray to talk me about these techniques.
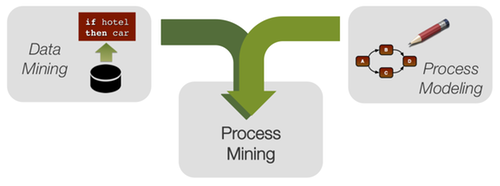
Process mining is a process management technique that allows for the analysis of processes based on event logs. During process mining, specialized data-mining algorithms are applied to event log datasets in order to identify patterns contained in event logs recorded by an information system.
I often analyze logs server so I have tested Process Mining for bot logs and I have new good visualizations to improve SEO.
Only 2 steps:
– Get your server logs ( IIS, Apache, Nginx, …)
– Use Disco ( Process Mining Software )
And I added some examples with Googlebot, Bingbot, Baiduspider, YandexBot.
Step 1: Get your server logs
Connect to your server and find yours logs with this command:$ sudo locate access.log
/var/log/nginx/data-seo.fr.access.log

/var/log/nginx/data-seo.fr.access.log.1

/var/log/nginx/data-seo.fr.access.log.2.gz

/var/log/nginx/data-seo.fr.access.log.3.gz

/var/log/nginx/data-seo.fr.access.log.4.gz

/var/log/nginx/data-seo.fr.access.log.5.gz

/var/log/nginx/data-seo.fr.access.log.6.gz

/var/log/nginx/data-seo.fr.access.log.7.gz
Ok, I found it.
Copy/paste your logs on your computer, you can work with one file or all files.
The difficulty is to identify each “session” ( i.e, a process instance ) because you can have the same IP for different sessions. Furthermore, if you limit your session to 30 minutes, you can cut a session. The best solution is to identify the first access to the robots.txt file for an IP and you can isolate each session whatever time passed. ( Thanks, Sylvain Deauré to give me the tip )
I have another surprise, Google shares the robots.txt file among Google bots. ( Thanks, John Mueller )
So, I have created an R program to change my log in a CSV file directly importable for Disco.
You can find my source code here: https://github.com/voltek62/BEA
Step 2: Use Disco
I have used a commercial tool “Disco” for this blog post but I am going to prepare another blog post for ProM, an open source software, I think I will create a new plugin to make easy usage of BEA ( Bots Event Analysis )
Configure Disco
Once you have generated your CSV file with my R program, importing it in Disco is easy: Simply select each column to configure it either as Case ID, Activity, Timestamp, Resource, or Attribute. Then press Start import.
Activity (i.e., a well-defined step in the process) = Url
Timestamp = Date
Ressoure = Rescode and/or IP
Case = Caseid ( (i.e, a process instance; here I use “session” concept)
Idea : You can create a csv files with inlinks or pagerank for each url
Use Case: View
The process mining technology in Disco can create process maps directly from your CSV, automatically.
You can have very useful statistics and export your graphs to png/jpeg files.
Pick your desired level of abstraction, choose from some metric visualizations projected right on your map, and create filters directly from activities or paths.
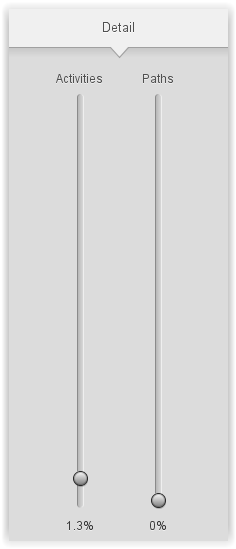
You can change Activities slider or change Paths slider. The activities are the process steps that happen in your process, for BEA, an activity is a URL.
The Activities slider influences the number of activities shown in your process map, ranging from only the most frequent activities up to all including the least frequent activities.
The Paths slider determines how many paths are shown in your process map, ranging from only the most dominant process flows among the shown activities up to all (even rare) connections between the activities.
You can monitor by Frequency
- Case Frequency
- Absolute Frequency
- Max Frequency
You can monitor by Performance
- Median duration
Filters
Disco has a lot of fast log filters, you can easily clean up your process data and focus your analysis on a particular period.
Besides, you can drill down by case performance, timeframe, variation, attributes, event relationships, or endpoints
Process Map Animation
With Disco you can create useful animations, visualizing your process as it happened, right on your process map. Animation can help you to instantly spot bottlenecks where work is piling up. You can detect when google bot changes its behavior on your website.
Step 3: Some examples
For each example, I fixed Activities slider to 100% and Paths slider to 0%.
I only used my logs for my french website data-seo.fr
- Googlebot Smartphone
- Google saves its resources and reserves them to important or new pages. With the map, you can detect all bottlenecks and unexpected variations from Googlebot and Googlebot-Smartphone. Googlebot slows down its crawl rate on older pages that don’t change very often.
Bing
- Bingbot does a lot more crawling than Googlebot and the biggest difference is in the older long-tail pages that Bingbot crawls more often than Googlebot.
Summary
BEA is a new solution to follow bots activities on your website.
It can give you important information because you can find:
– what are ignored pages
– where bot spends too much time crawling
– where you have any 4XX and 5XX errors
– what updated pages are never visited
In my next blog post, I am going to create an open source plugin for proM and you can test BEA without R program.
If you want to learn Proces Mining, I advise you to follow this MOOC: https://www.coursera.org/learn/process-mining/home/welcome
If you want an accelerated training, I will prepare SEO Conferences about it in 2017.
For your information, if you are french, Cocon.se has published a detailed article about BEA: http://cocon.se/concret/logs-bea/


You said: “it gives us important information”.
– what are ignored pages
– where bot spends too much time crawling
– where you have any 4XX and 5XX errors
– what updated pages are never visited
What could we do next with this information?
It is a very good question and I am going to prepare a blog post to give you all answers: optimise internal linking, remove bad and duplicate content, improve web performance, …