
This is my first article on how to create dashboards with R and ScreamingFrog.
I begin with active pages and a simple methodology to classify URLs.
The definition of an active page is : A page that receives at least one organic visit over a given timeframe. In this case study, the timeframe is set to 30 days.
Considering active pages is as useful to make decisions, as it is to measure the impact of internal linking optimizations or monitor SEO efficiency on a particular section of the website.
Step 1: Crawl with Screaming Frog
Before we can detect active pages, we need to crawl your website.
For this example, I use Screaming Frog, as it is a very useful crawler.
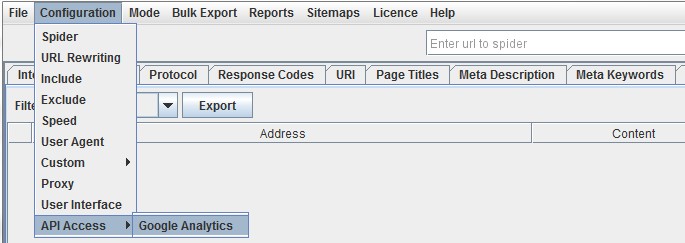
To set this up, start the SEO Spider : Screaming Frog and go to ‘Configuration > API Access > Google Analytics’.
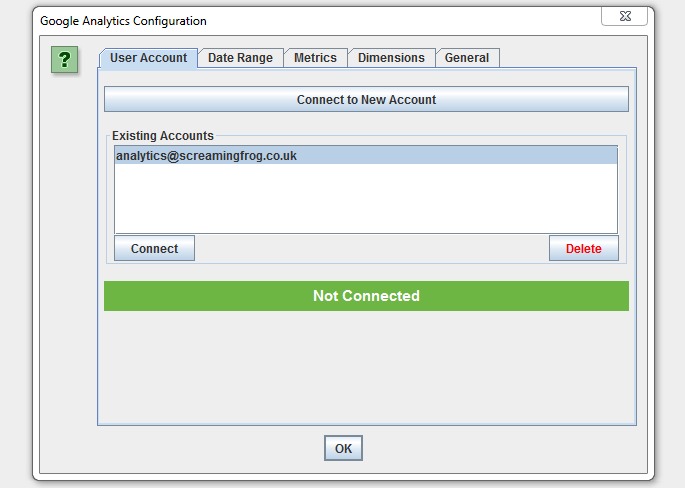
Then you just need to connect to a Google account by granting the ‘Screaming Frog SEO Spider’ app permission to access your account to retrieve the data. Google APIs use the OAuth 2.0 protocol for authentication and authorization.
Once you ‘re connected, you can choose the relevant Analytics account, property, view, segment and date range. ( last 30 days )
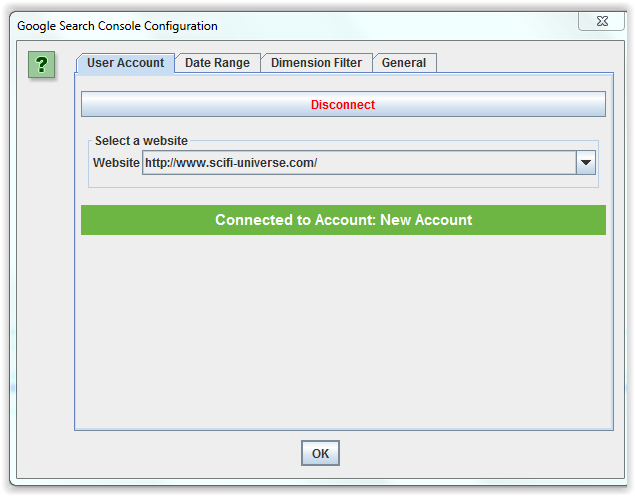
Now, you can restart this operation for the Search Console : ‘Configuration > API Access > Google Search Console’.
Start by launching Screaming Frog and crawling your website.
When the crawl is finished, select Bulk Export > All Inlinks from the top menu, and save the XLSX file.
I avoid CSV format because if you have double quotes in your text, you can have some errors when you load the data.
The XLSX contains a list of all the internal links on your website.
We will use this file to detect all active pages and classify URLs.
Step 2: Detect Active Pages with R
R is a free software for statistical computing and graphics that runs on a wide variety of platforms. ( Mac OS X, Windows, Linux)
Download and install it, if you don’t already have it.
Install the readxl,dplyr,stringi packages by launching the R console and executing :
install.packages("readxl")
install.packages("stringi")
install.packages("dplyr")
Once the packages are installed, you will be able to use the following codes.
I use the readxl package to read my xlsx file and load my big dataframe with 350 000 URLs.
- If you are beginner in R , I advice you to read this tutorial
- If you want to learn R, you can test 2 days of unlimited access to all R and data science courses on Datacamp platform
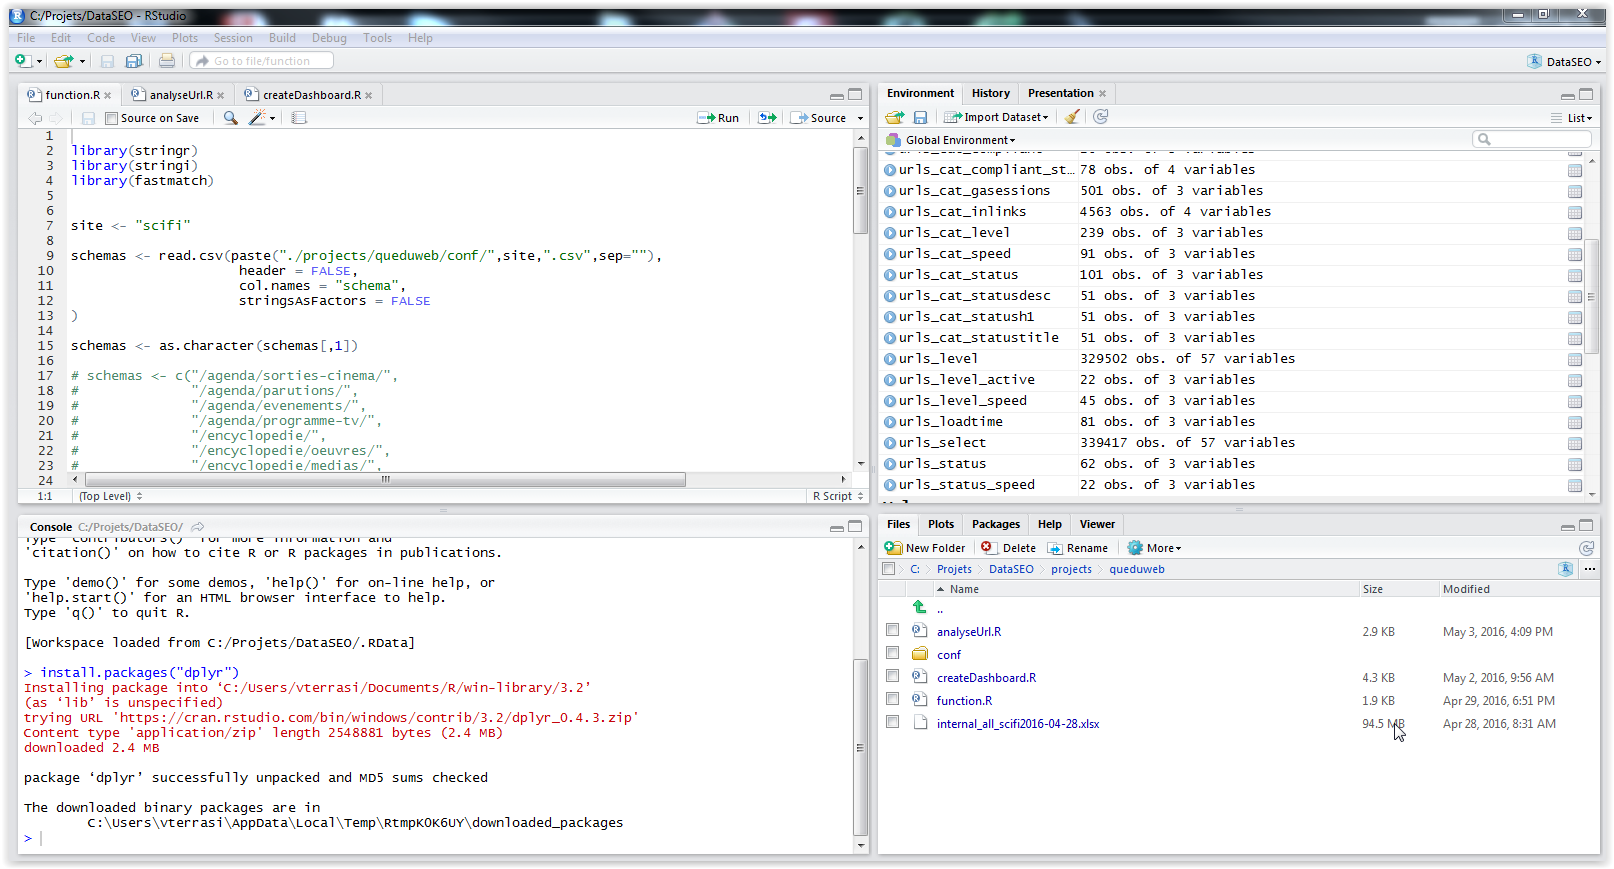
As you can see in my previous screenshot, I have separated my code in three files ( function.R, analyseUrl.R, createDashboard.R ) but you can copy/paste all code in same file.
So, you just use a loop to read URLs and detect a GA Sessions in the last 30 days and classify URLs.
library(dplyr)
library(stringi)
library(readxl)

source("function.R")

## use xlsx format to prevent read errors with csv and xls
urls <- read_excel("internal_all_scifi2016-04-28.xlsx",
 sheet = 1,
 col_names = TRUE,
 na = "",
 skip=1)

##FIX : remove last line
urls_select <- head(urls,-1)

for (j in 1:nrow(urls_select))
{
 # display current url
 print(urls_select$Address[j])
 # classify urls
 urls_select$Cat[j] <- findSchema(urls_select$Address[j])

 # detect active pages
 if (!is.na(urls_select
This is my first article on how to create dashboards with R and ScreamingFrog.
I begin with active pages and a simple methodology to classify URLs.
The definition of an active page is : A page that receives at least one organic visit over a given timeframe. In this case study, the timeframe is set to 30 days.
Considering active pages is as useful to make decisions, as it is to measure the impact of internal linking optimizations or monitor SEO efficiency on a particular section of the website.
Step 1: Crawl with Screaming Frog
Before we can detect active pages, we need to crawl your website.
For this example, I use Screaming Frog, as it is a very useful crawler.
To set this up, start the SEO Spider : Screaming Frog and go to ‘Configuration > API Access > Google Analytics’.
Then you just need to connect to a Google account by granting the ‘Screaming Frog SEO Spider’ app permission to access your account to retrieve the data. Google APIs use the OAuth 2.0 protocol for authentication and authorization.
Once you ‘re connected, you can choose the relevant Analytics account, property, view, segment and date range. ( last 30 days )
Now, you can restart this operation for the Search Console : ‘Configuration > API Access > Google Search Console’.
Start by launching Screaming Frog and crawling your website.
When the crawl is finished, select Bulk Export > All Inlinks from the top menu, and save the XLSX file.
I avoid CSV format because if you have double quotes in your text, you can have some errors when you load the data.
The XLSX contains a list of all the internal links on your website.
We will use this file to detect all active pages and classify URLs.
Step 2: Detect Active Pages with R
R is a free software for statistical computing and graphics that runs on a wide variety of platforms. ( Mac OS X, Windows, Linux)
Download and install it, if you don’t already have it.
Install the readxl,dplyr,stringi packages by launching the R console and executing :
install.packages("readxl")
install.packages("stringi")
install.packages("dplyr")
Once the packages are installed, you will be able to use the following codes.
I use the readxl package to read my xlsx file and load my big dataframe with 350 000 URLs.
- If you are beginner in R , I advice you to read this tutorial
- If you want to learn R, you can test 2 days of unlimited access to all R and data science courses on Datacamp platform
As you can see in my previous screenshot, I have separated my code in three files ( function.R, analyseUrl.R, createDashboard.R ) but you can copy/paste all code in same file.
So, you just use a loop to read URLs and detect a GA Sessions in the last 30 days and classify URLs.
GA Sessions`[j])) { urls_select$Active[j] = TRUE } else { urls_select$Active[j] = FALSE } }
Step 3: Classify your URLs
I use the stri package to detect a pattern match . It is very fast !
You have just to add each pattern you want to monitor.
You can create a file “function.R” and copy/paste this code :
schemas <- c("/agenda/example1/",
             "/book/example2/",
             "/movie/")

findSchema <- function(str) {

  if(is.null(str))
    return("no match")

  if (is.na(str))
    return("no match")

  if (nchar(str)<3)
    return("no match")

  stri <- stri_detect_fixed(str,schemas)
  res 1)
    return(schemas[max(res)])
  else
    return("no match")

}
Step 4 : Display your dashboard
In R, you just need to use the dplyr package which provides functions that allow for simple aggregation of results.
The group_by() function sets up how you want to group your data.
Then, I use the ggplot2 package to draw some histograms.
I give you some examples :
library(ggplot2)
library(dplyr)

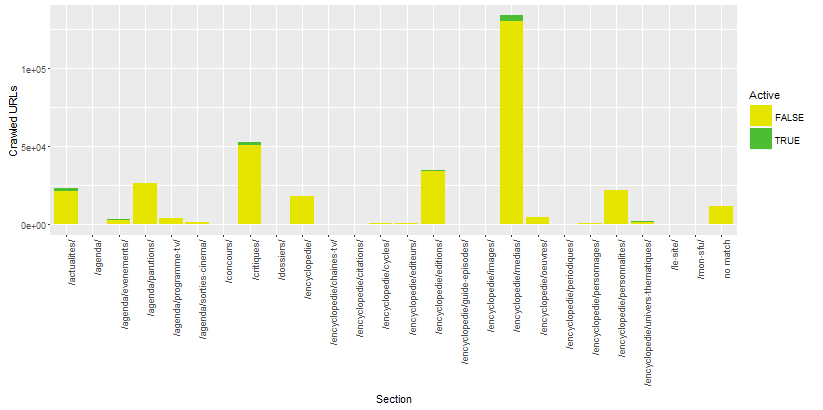
urls_cat_active <- group_by(urls_select,Cat,Active) %>%
 summarise(count = n())

p <- ggplot(urls_cat_active, aes(x=Cat, y=count, fill=Active) ) +
 geom_bar(stat = "identity", position = "stack") +
 scale_fill_manual(values=c("#e5e500", "#4DBD33")) +
 theme(axis.text.x = element_text(angle = 90, hjust = 1)) +
 labs(x = "Section", y ="Crawled URLs")

print(p)
Active / Not Active Urls by pagetype segment :
urls_level_active <- group_by(urls_select,Level,Active) %>%
 summarise(count = n()) %>%
 filter(Level<12)

p <- ggplot(urls_level_active, aes(x=Level, y=count, fill=Active) ) +
 geom_bar(stat = "identity", position = "stack") +
 scale_fill_manual(values=c("#e5e500", "#4DBD33")) +
 labs(x = "Depth", y ="Crawled URLs")

print(p)
Active / Not Active URLs by depth :
Conclusion
The only limit is your imagination.
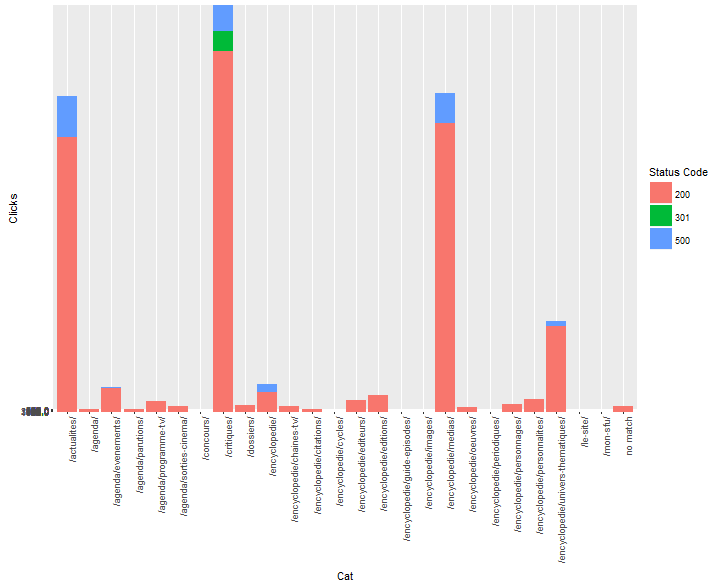
You can create an original dashboard which display number of clicks ( Search Console ) in different sections by http status code ( crawler ).
Only two lines of code !
urls_level <- filter(urls_select, Level<10) %>%
 arrange(`Status Code`)

p <- ggplot(urls_level, aes(x=Cat, y=Clicks, fill=`Status Code` ) ) +
 geom_bar(stat = "identity", position = "stack") +
 theme(axis.text.x = element_text(angle = 90, hjust = 1))
Clicks in Google SERPs by pagetype segments and http status code :
Photo Credits: Marvel.com






Leave a Reply